To set xticks in Matplotlib, use the `xticks()` function with the desired arguments. This allows you to display specific ticks on the x-axis of your plot.
When working with Matplotlib, you may find it necessary to customize the x-axis ticks to better represent your data. By setting xticks, you can explicitly specify the positions of each tick on the x-axis, ensuring that they align precisely with your data points.
This can be helpful when your data has unique intervals or when you want to display only a subset of the available data on the x-axis. We’ll explore how to use the `xticks()` function in Matplotlib to achieve this level of customization.

Credit: pub.towardsai.net

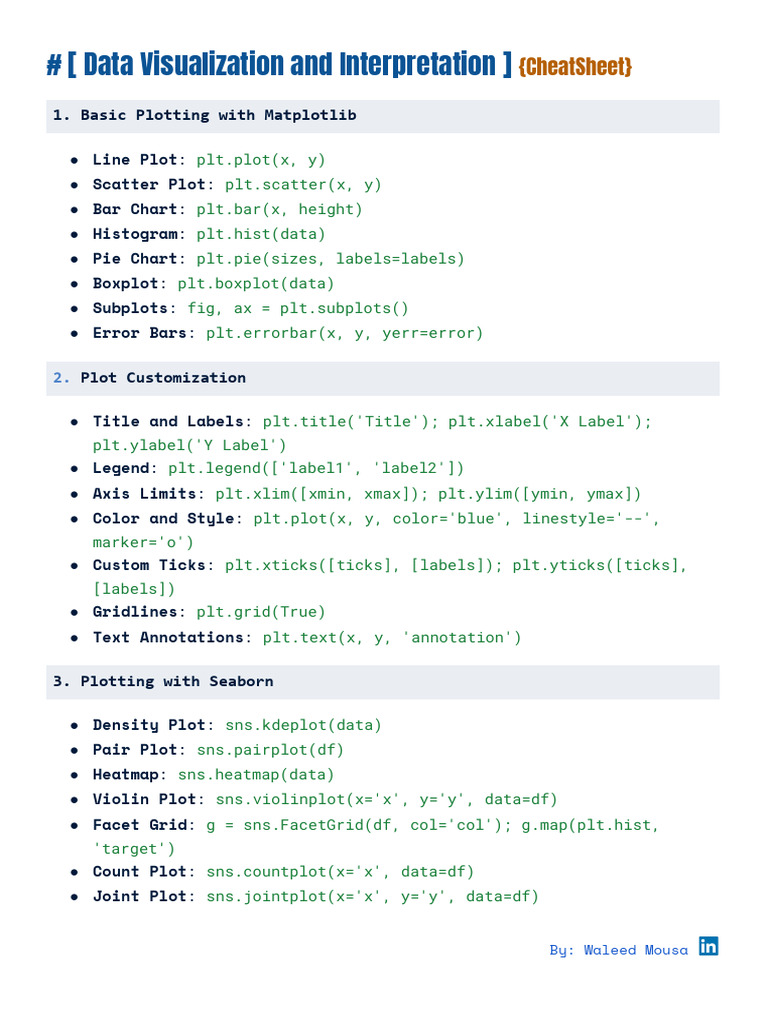
Understanding Xticks In Matplotlib
Learn how to set the xticks in Matplotlib with this comprehensive guide. Discover the step-by-step process to effectively customize your x-axis ticks for improved data visualization.
What Are Xticks?
Xticks in Matplotlib are used to mark specific locations of the x-axis of a plot with tick marks and corresponding labels. They represent the values or categories along the x-axis, providing a reference for the data points in a plot. These tick marks and labels are essential for understanding the distribution and relationship of data points in a graphical representation.
Why Are Xticks Important In Matplotlib?
In Matplotlib, xticks play a crucial role in enhancing the readability and interpretability of plots. They allow us to accurately define the positions of tick marks and labels on the x-axis, making it easier to identify specific data points and draw meaningful insights from the plot. Without proper xticks, the x-axis would be devoid of any context or reference points, making it challenging to understand the underlying data.
Methods For Custom Tick Placement
Learn how to set xticks in Matplotlib with custom tick placement methods. These techniques will help you efficiently display and manipulate the tick positions on your plot for better visualization.
When it comes to visualizing data in Matplotlib, having control over the positioning of ticks on the x-axis is crucial. Custom tick placement not only enhances the clarity of the plot but also allows you to highlight specific points of interest. Matplotlib provides several methods that enable you to achieve this level of customization. Let’s explore three commonly used methods for custom tick placement in Matplotlib.
Using The Set_xticks() Method
The set_xticks() method in Matplotlib allows you to manually specify the locations for the ticks on the x-axis. By passing a list or array of values to this method, you can precisely position the ticks according to your desired intervals or specific data points. It’s a convenient way to align the ticks with important features of your plot.
import matplotlib.pyplot as plt

# Example usage of set_xticks() method
plt.plot(x, y)
plt.xticks([1, 2, 3, 4, 5])
plt.show()
Using The Set_xticklabels() Method
The set_xticklabels() method complements the set_xticks() method by allowing you to assign custom labels to the ticks on the x-axis. By providing a list of labels that corresponds to the specified tick positions, you can effectively replace the default numeric tick labels with more descriptive or meaningful values. This method is useful when you want to provide context or additional information directly on the plot itself.
import matplotlib.pyplot as plt

# Example usage of set_xticklabels() method
plt.plot(x, y)
plt.xticks([1, 2, 3, 4, 5], ['A', 'B', 'C', 'D', 'E'])
plt.show()
Using The Set_xticks() And Set_xticklabels() Methods Together
In certain cases, you may require both custom tick positions and labels for the x-axis ticks. Matplotlib allows you to achieve this by using the set_xticks() and set_xticklabels() methods together. By passing both the tick positions and corresponding labels as arguments, you can precisely control the placement and labeling of ticks simultaneously. This method gives you the flexibility to create informative and visually appealing plots.
import matplotlib.pyplot as plt

# Example usage of set_xticks() and set_xticklabels() methods together
plt.plot(x, y)
plt.xticks([1, 2, 3, 4, 5], ['A', 'B', 'C', 'D', 'E'])
plt.show()
By utilizing these three methods in Matplotlib – set_xticks(), set_xticklabels(), and their combination, you can achieve custom tick placement on the x-axis. Whether you need to highlight specific data points, provide additional context, or improve the overall clarity of the plot, these methods offer flexible solutions to meet your visualization requirements. Experiment with different intervals, positions, and labels to effectively communicate your data to the audience.
Advanced Techniques For Custom Tick Placement
When it comes to visualizing data with matplotlib, setting the xticks is an essential part of improving the readability of your plots. With advanced techniques for custom tick placement, you can further enhance the presentation of your data. In this article, we will explore three powerful methods to achieve this: changing the tick labels, rotating the tick labels, and formatting the tick labels.
Changing The Tick Labels
By default, matplotlib assigns tick labels based on the data range in your plot. However, you might find the need to customize the tick labels to convey specific information. Fortunately, matplotlib provides a simple way to achieve this.
To change the tick labels, you can make use of the `xticks()` function. This function allows you to pass an array of custom labels as the first argument, along with the desired tick positions as the second argument.
Here’s an example code snippet that demonstrates how to change the tick labels:
import matplotlib.pyplot as plt

# Sample data
x = [1, 2, 3, 4]
y = [5, 6, 7, 8]

# Plotting
plt.plot(x, y)

# Changing the tick labels
plt.xticks([1, 2, 3, 4], ['A', 'B', 'C', 'D'])

# Display the plot
plt.show()
In this example, we have assigned custom labels ‘A’, ‘B’, ‘C’, and ‘D’ to the respective tick positions 1, 2, 3, and 4 on the x-axis.
Rotating The Tick Labels
When dealing with long tick labels, it is common to encounter overlapping text that hinders readability. To overcome this challenge, you can rotate the tick labels to a more readable angle.
To achieve this, you can use the `set_xticklabels()` function combined with the `rotation` parameter. The `rotation` parameter accepts an angle value (in degrees) to rotate the labels.
Here’s an example code snippet that demonstrates how to rotate the tick labels:
# Plotting
plt.plot(x, y)

# Rotating the tick labels
plt.set_xticklabels(['A', 'B', 'C', 'D'], rotation=45)

# Display the plot
plt.show()
In this example, we have rotated the tick labels by 45 degrees using the `rotation` parameter. This ensures that the labels are presented diagonally for improved readability.
Formatting The Tick Labels
In some cases, you might want to format your tick labels to display specific units, decimal places, or other formatting styles. Matplotlib allows you to achieve this by employing format strings.
Format strings consist of a combination of literal text and format specifiers, which define the formatting rules for tick labels. These format specifiers help you control the appearance of the labels, including precision, padding, and more.
Here’s an example code snippet that demonstrates how to format the tick labels:
# Plotting
plt.plot(x, y)

# Formatting the tick labels
plt.xticks([1, 2, 3, 4], ['A', 'B', 'C', 'D'], rotation=45, \
           fontsize=12, fontweight='bold')

# Display the plot
plt.show()
In this example, we have formatted the tick labels by specifying the rotation angle, font size, and font weight to enhance their appearance. You can use various format specifiers to achieve your desired label formatting.

Credit: zebrabi.com

Credit: towardsai.net
Frequently Asked Questions For How To Set Xticks In Matplotlib
How To Set Xticks In Matplotlib?
Setting xticks in Matplotlib allows you to customize the x-axis tick locations and labels on your plot. You can specify the exact positions of the ticks and even modify their labels. By using the `xticks()` function, you can easily achieve this customization and make your plot more expressive and readable.
Why Are Xticks Important In Matplotlib?
Xticks in Matplotlib hold great importance as they provide valuable information about the x-axis values. They help readers interpret the plot more accurately and understand the data represented on the x-axis. By customizing the xticks, you can highlight specific points of interest or make the plot more visually appealing and understandable.
How To Customize Xticks In Matplotlib?
Matplotlib provides various options to customize xticks. You can set the positions and labels of the xticks manually using the `xticks()` function or use the `MultipleLocator` class from the `matplotlib. ticker` module to set the tick locations. Additionally, you can adjust the font size, tick length, and other properties to suit your plot’s requirements.
What Is A Major Xtick?
In Matplotlib, major xticks refer to the significant tick positions along the x-axis. These ticks represent major divisions of the x-axis and are often labeled with values. By default, Matplotlib automatically calculates appropriate major xticks based on the data range.
However, you can customize major xticks by specifying the positions and labels using the `xticks()` function.
Conclusion
Setting xticks in Matplotlib can greatly enhance the presentation of your data in plots. By customizing the tick locations and labels, you can effectively communicate your insights to the audience. This blog post has provided you with a step-by-step guide on how to set xticks in Matplotlib.
From understanding the importance of tick positions to utilizing the set_xticks() and set_xticklabels() functions, you now have the knowledge to create visually appealing and informative plots. Take advantage of this useful feature in Matplotlib to enhance your data visualization skills and effectively convey your message to the viewers.